Day 109 of Lockdown | Market Update
The second of a bi-weekly series of lockdown-inspire market commentaries; this one the first in our newly imposed curfew status.


Last night’s address by President Cyril Ramaphosa will certainly be fresh in everyone’s minds. As will it’s reintroduction of a curfew, this time from 9pm through 4am, and, arguably more importantly to many people judging by what has been trending on Twitter in the last twenty-four hours, it’s reintroduction of alcohol limitations. The State of Emergency was also extended to mid-August. Further movement and economic restrictions are, likely, dependent on the State of Emergency being extended beyond 15 August. South Africa now has more than 275,000 confirmed positive cases; placing it in the top 10 worldwide. Since I last wrote to you, the case count has nearly tripled. Adjusting for population size, however, South Africa is ‘only’ in the top 30 with 4,600 positive cases per million people. Well above the global average of 1,600 but more than 2 million tests have been conducted and, as the President said last night, more than 20 million people have been screened.
Markets have, naturally enough, vacillated between bouts of optimism that a vaccine will be found relatively soon, a number of clinical trials are underway, and growing concern that lockdowns will feature widely in our collective future, as citizens of Melbourne recently found out when the State of Victoria placed the city into a six-week lockdown. In the last two weeks, despite much activity, markets have gone essentially nowhere and the risks of a downturn have increased. Out of interest, the NFB AM International Investment Committee having increased equity exposure three to four months ago, elected to reduce global equity exposure by 5% for the NFB Global Balanced Fund of Funds.
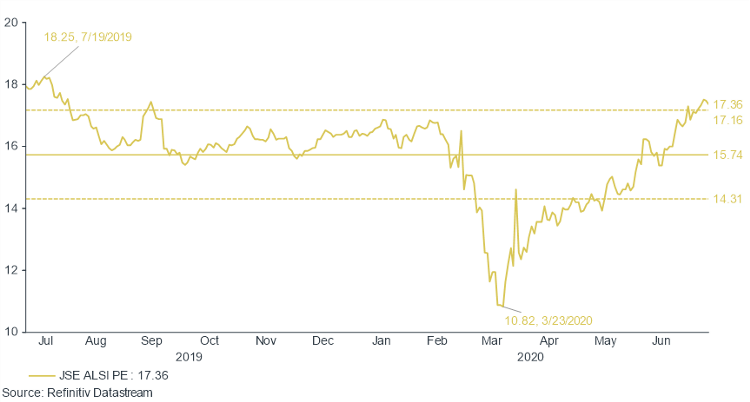
Interestingly, the JSE All Share Index’s PE ratio is at or near a 1-year high. A PE ratio is a measure of valuation indicating the price paid for each unit of earnings. The higher the PE, the more richly valued earnings are. Prices are up 45% in the last three to four months and, to no one’s surprise, earnings haven’t come through. Resulting in a 17 PE on our market which was last seen 12 months ago. The PE ratio can only return to more reasonable historical levels of around 15 in one of three ways: prices fall, earnings rise or a combination of the two. Given that, outside of the resource companies and Naspers, it is most likely that earnings fall and therefore, that the PE rises, it is most likely that either the South African equity market becomes even more overvalued than it is now (i.e. prices stay the same while earnings fall) or that prices either fall or, more worryingly in our view, drift sideways. This latter concept only results in a lower PE ratio if earnings trend higher over time and would therefore mean a stagnant equity market, at index level, for many years to come given that this comes about either through growth and/or inflation, neither of which is likely. Generally speaking. There’s obviously quite a bit of room for active equity index and/or stock selection to obviate some of these dynamics and to make a meaningful contribution to returns.JSE PE Ratio

Beyond hope of a vaccine and lockdown concerns, South African financial markets have had to contend with a sharply deteriorating fiscal position. This was clearly telegraphed during Finance Minster Tito Mboweni’s supplementary budget address from ten or so days ago, but has been compounded since then by a growing sense of disbelief by market participants in the execution-ability of the State. Additional support for Denel, Land Bank and SAA has compounded an already weak situation. Eskom’s return to load-shedding with its attendant consequences for economic growth simply spurs on the argument that the Government is being too optimistic with it’s debt-to-GDP forecasts. Remember that there are two parts to most macro-economic statistics. The item being observed itself (in this instance debt) and its size relative to GDP. Even if debt were stable, if the economy falters more than was anticipated, debt-to-GDP worsens beyond expectations. Moody's, however, did come out with a credit view during the course of last week that was broadly supportive of the conclusions reached by National Treasury.
Much emphasis is being placed on the IMF loan due at the end of the month. Somewhat bizarrely, but entirely understandably, the market now wants the IMF loan not to be caveat-free as many coronavirus relief loans are but rather for it to come with austerity measures. If this happens, the bond market is likely to rally because it is almost desperate for someone to impose austerity measures on the Government as it appears incapable of doing so itself. Perhaps incapable is too strong a word given the intractability of the public sector wage bill. In the environment described in the preceding paragraph and that described in this one, the South African bond market has weakened with the yield on the 10-year nominal bond increasing from 8.6% to 9.5% since just before the budget speech. (Rising yields are commensurate with falling bond prices). These yields appear attractive and we have seen significant interest in this portion of the market but as a warning to investors: these yields will only be the investor’s actual investment experience if the bonds are held to maturity which in the above instance is 10 years away. That is a long holding period and needs to be considered on the way into the bond. An IMF loan and the forthcoming 25 basis point interest rate decrease from the South African Reserve Bank anticipated by almost all market participants places a cap on how high yields can reasonably go right now, though this is tempered by the lack of appetite we’re seeing in the weekly government bond auctions where the supply-side has nearly doubled but the demand-side has become increasingly skeptical. And we haven’t even begun to talk about the multi-faceted aspects of Government’s proposed infrastructure bond and its interplay with prescribed assets.
As always there’s lots to discuss and there’s the weekly chart book to review here, so please set up some time with me if you’d like to take what has essentially been a lengthy conversation opener into an individual discussion of some sort.
Stay safe. Wear a mask.
Market Data
| Asset Class | Last Week | Last Month | Last Year | Last 3 Years |
| Local Cash | 0.10% | 0.43% | 6.80% | 7.14% |
| Local Bonds | -0.08% | -1.31% | 1.45% | 7.78% |
| Local Property | -2.42% | -0.74% | -38.19% | -17.57% |
| Local Equity | 1.70% | 3.34% | -0.35% | 5.41% |
| Global Property | -2.48% | -5.85% | -18.37% | -0.09% |
| Global Equity | 1.80% | 0.62% | 5.06% | 7.83% |
| USDZAR | -1.71% | 0.91% | 19.14% | 7.64% |
Helpful Resources
Please take the following into account:
- Wherever possible, total return indices have been used. These include the effects of dividends, interest and coupon payments in addition to price movements. Please take data presented as, generally, inclusive of price and income effects.
- Performance and other market data excludes the effect of income, capital gains and dividend withholding taxes as well as excluding advice, administration and asset management costs. Please take data presented as exclusive of tax and cost effects.
- Data is based on the previous Friday’s closing prices but as the situation is fluid the market commentary may or may not extend beyond Friday’s close. Other data, links, estimates, etc referred to are correct as at the time of writing.
- Collective investment schemes and other similar products performance information is based on data provided by Morningstar, which is signed off the first week of each month. In general, we will refrain from covering this until sign-off is obtained.
- NFB Asset Management publishes a monthly newsletter called The Rationalist. For as long as these weekly emails are being sent we have elected not to publish The Rationalist. Expect the monthly NFB AM schedule to resume once the lockdown is lifted.
- The previously used Refinitiv data code for Local Bonds (SAFRALL) has been discontinued, therefore a new code (ASAGVAL) has been used for calculations moving forward which is subject to revision in the future.


