Day 123 of Lockdown | Market Update
The third in a bi-weekly series of lockdown-inspired market commentaries; this one covering interest rates, gold and trade wars.


Let’s begin our coronavirus statistical review on a positive note, shall we? Of the 16 million confirmed positive cases, more than 10 million have recovered for a recovery rate of 61%. South Africa’s recovery rate is hovering just below 60%. We are, though, unsure how re-infections affect the preceding mathematics. At 7,504 cases and 114 deaths per million, however, South Africa is in the ignominious position of being well above the global averages of 2,107 and 83 respectively. We all knew a peak was coming (we deliberately write “a peak”, as there very well could be multiple peaks) but there’s rather a large difference between the knowledge that a COVID-19 peak is on its way and the actual experience once it arrives. Those in the Western Cape may be more accustomed to this than those of us based either in Gauteng or the Eastern Cape as, hopefully, they appear to have begun flattening out. One last comment on coronavirus before we close this introductory paragraph: we find it terribly disheartening that President Cyril Ramaphosa had to include in his national address last Thursday a second-half focused on those who corrupt the State’s coronavirus relief efforts, particularly through graft and theft, and that they will face the full might of the law. It’s despicable behavior and a sad indictment on our country that a national address on this matter was required.
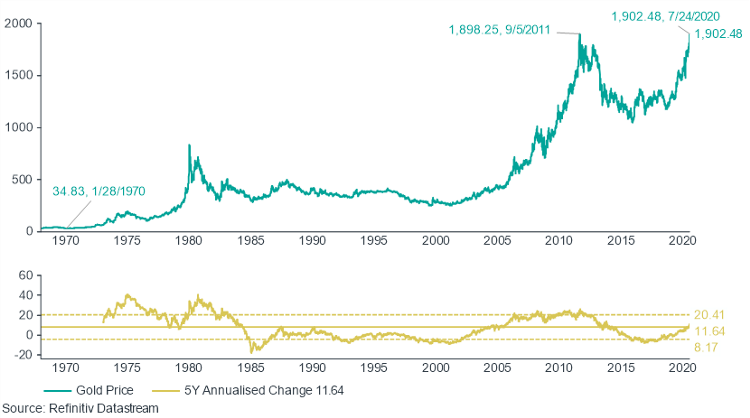
As we write this, gold has hit an all-time high in excess of $1,900 an ounce which goes some way to explaining why the JSE’s resource sector is up 20% over the last year whereas the industrial and financial sectors are down 35%. If only beneficiation was a larger, more meaningful part of our economy beyond just the usual business of extracting the resources from the ground and perhaps refining some gold, we may have experienced a swifter return to normalcy as the mines were amongst the first to emerge from the worst of the lockdown. For a fascinating study of the supply/demand dynamics of the gold price and how some of the record price-setting is COVID-19 related have a look at this info graphic from Visual Capitalist. The tourism industry, which the latest figures from Statistics South Africa confirms, is on its knees with “volumes” down 98% from a year ago. One also has to wonder what the extension of the school year beyond December and into 2021 will do to local tourism numbers when families are no longer able to take their December vacations, if they could even have afforded to do so this year. Particularly as the tourism industry looks likely to be solely reliant on domestic travel for the foreseeable future as borders remain firmly shut.
Gold Price, USD

If coronavirus and/or its attendant affect on the domestic economy didn’t give you enough to be concerned about, the fact that US-Sino relations have degraded over the last few weeks should. Following the US closure of the Chinese consulate in Houston and its earlier travel ban on members of the Chinese ruling party (which included their families), over the weekend China closed the United State’s consulate in Chengdu. This occurring while London reverses its position on Huawei undertaken in January this year, which looks likely to receive support from Canada and the European Union in the coming weeks as they make similar deliberations about their national security. This comes right in the thick of China’s change in security stance on Hong Kong which has forced its trading partners like the US to reconsider Hong Kong’s “special status”. And then there’s TikTok, the video-sharing social media platform, which is likely to be banned (if it hasn’t already) beyond just the US and India. This one we can more easily understand though given China’s poor track record of secretly embedding unwanted elements into technology exported from their country. Anyone remember the spying hardware embedded in their computer chips from a few years back?
Amidst the doom-mongering, which even this newsletter is somewhat unusually guilty of this week, the South African Reserve Bank’s announcement last week of a rate cut is welcome news to those who have debt on their balance sheets. Those who have meaningful cash-related assets and/or income needs will be less enthused. This was the SARB’s fifth successive interest rate cut, this time amounting to 25 basis points or 0.25% bringing total interest rate cuts this year to 3% and taking the prime overdraft rate to 7%. Importantly, two members of the SARB’s Monetary Policy Committee preferred to leave interest rates unchanged. This, together with the SARB’s forecast models, indicates that South Africa is very likely at the end of the rate cutting cycle with perhaps only one, maybe two at a stretch, more interest rate cuts of 0.25% each to come. There is, however, a strong argument to be made that in these desperate times that the SARB should be going much, much further; well beyond just cutting interest rates and ensuring orderly price transmission in the bond market. There is an argument that they should go as far as negative real interest rates which, given an inflation rate of 3%, implies a cut in rates of 0.5 to 0.75%. Negative real interest rates can be effective in stimulating an economy because the cost of buying something on credit now, in terms of interest charged in the debt, is less than the cost of waiting, i.e. inflation.
Interestingly and despite there being much to write to you about this week, other than the South African listed property sector which is down a few more percent since we last wrote to you, there’s not been much change in the financial markets over the full time frame since our last lockdown email. South African and global equities are up between just 0.4% and 1.2% over the last two weeks. There’s a growing sense that, outside of a few overheated technology stocks (can we include Tesla in this group?), the relief rally is running out of steam as the world fronts up to a second wave of infections.
As ever, our usual weekly chart book can be found here and, in the last week or so, our Asset Management team has published a commodity-specific chart book. Let me know if you’d like me to email you a copy.
Stay safe. Stay positive. Wear a mask.
Market Data
| Asset Class | Last Week | Last Month | Last Year | Last 3 Years |
| Local Cash | 0.09% | 0.41% | 6.71% | 7.11% |
| Local Bonds | 1.56% | 0.80% | 2.82% | 7.66% |
| Local Property | -4.97% | -0.22% | -40.46% | -19.58% |
| Local Equities | -0.48% | 2.26% | -0.19% | 4.12% |
| Global Property | -0.25% | 0.34% | -17.18% | -1.16% |
| Global Equity | 0.00% | 5.31% | 5.48% | 7.39% |
| USDZAR | 0.07% | -3.65% | 20.17% | 8.74% |
Helpful Resources
Please take the following into account:
- Wherever possible, total return indices have been used. These include the effects of dividends, interest and coupon payments in addition to price movements. Please take data presented as, generally, inclusive of price and income effects.
- Performance and other market data excludes the effect of income, capital gains and dividend withholding taxes as well as excluding advice, administration and asset management costs. Please take data presented as exclusive of tax and cost effects.
- Data is based on the previous Friday’s closing prices but as the situation is fluid the market commentary may or may not extend beyond Friday’s close. Other data, links, estimates, etc referred to are correct as at the time of writing.
- Collective investment schemes and other similar products performance information is based on data provided by Morningstar, which is signed off the first week of each month. In general, we will refrain from covering this until sign-off is obtained.
- NFB Asset Management publishes a monthly newsletter called The Rationalist. For as long as these weekly emails are being sent we have elected not to publish The Rationalist. Expect the monthly NFB AM schedule to resume once the lockdown is lifted.
- The previously used Refinitiv data code for Local Bonds (SAFRALL) has been discontinued, therefore a new code (ASAGVAL) has been used for calculations moving forward which is subject to revision in the future.


