A Higher Hurdle for Local Asset Allocators
Paul Marais from NFB Asset Management looks at why it is difficult for South African asset allocators to look beyond the yields available in local government bonds.


The South African repurchase rate is currently at 3.5%. September’s CPI came in at 3.0%, and therefore real interest rates remain positive. The estimation error present in any macro-economic data does however imply that rates could very well be mildly negative in reality.
Other than education, which currently increasing at 6.4% per annum, none of the major sub-components of the South African Consumer Price Index are running north of 4%. Even medical inflation is officially only at 3.7%.
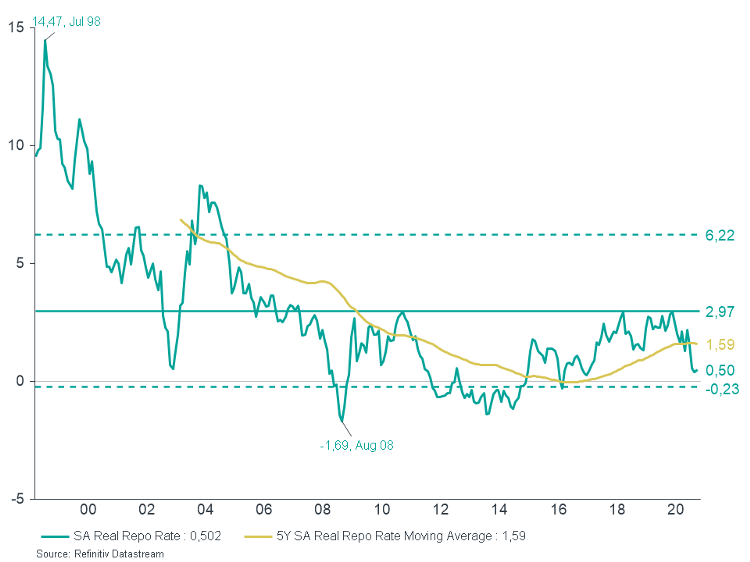
South African real interest rates have averaged 3% since 2000, with a range of essentially 0% to 6.2%. This is charted below.
At 0.5% real, the current level of interest rates is accommodative, despite not being negative and despite the general perception that the SARB hasn’t been aggressive enough. The most negative rates have been was in August 2008, in the midst of the Global Financial Crisis, when they exceeded -1.5%.

Forward Rate Agreements
The standardised three-month forward rate agreement implies a roughly 50% probability of a 25 basis point cut in the repurchase rate by the SARB in November. A week ago, the probability was closer to 75%.
More importantly, forward rate agreements a week ago were pricing in a 30% chance of a 1% increase in interest rates 18 months from now, but this has surged to just under a 50% probability. Extend the time horizon by an additional three months, and the probability of an interest rate increase of 1% rises to 70%.
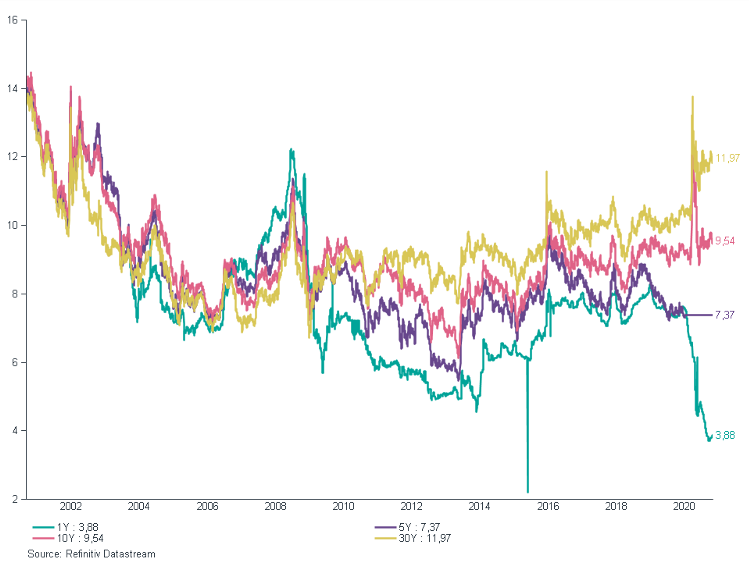
This implies that an already steep yield curve, particularly in the belly of the curve (roughly speaking maturities of 2 to 12 years), has become marginally steeper at the front end. As an indication of how steep the yield curve has become: over the last year, the difference between the yield on 1-year debt (green line below) and 10-year debt (pink line below) has increased from 2.5% to more than 6% per annum. That is a very significant pick-up in compensation for taking on duration risk.
SA Yield

Ex-Ante Inflation
The trouble with the analysis thus far centres on real yields typically being calculated using current (i.e. historical or ex post) inflation rates, whereas investors will obviously experience future inflation rates (ex-ante). It’s possible, however, to get a feel for what markets expect inflation rates to be by calculating implied inflation as the difference between a nominal and an inflation-linked bond with the same characteristics (maturity profile, credit quality, etc).
Ordinarily this is only ever an estimation, as it is difficult to perfectly harmonise all the appropriate characteristics. Using this methodology, inflation over the medium-term (out to about 2026/28) is expected to average 5.2% per annum. A year ago, the implied inflation rate was about 1% higher.
Given the collapse in demand-side inflation drivers, inflation is unlikely to accelerate meaningfully over the next year or two. To get at a 5.2% average inflation rate, therefore, inflation has to be meaningfully higher at the back-end of this forecast period.
The Trade-Off/s
With the ever-worsening state of government’s finances, there is a reasonable risk that inflation rates go even higher than the back-end rate required to achieve an average inflation rate of 5.2%. This is the risk investors are taking and partly explains the significant compensation being offered.
However, there doesn’t appear to be any real risk that investors will suddenly be better compensated by higher rates in the near term. That’s in a narrow, binary cash-versus-bonds world which doesn’t exist.
What are the alternatives though?
Locally listed property is lower now that it was at the height of the crisis, rand volatility remains elevated and, outside of a handful of mostly tech-related stocks, global equities haven’t been that exciting either. Arguably, the narrowness of the recovery and recent market weakness provide active investors an opportunity, but the hurdle rate relative to longer-dated bonds is high.
Caveats: the US elections lie ahead, the MTBPS was less than a week ago, and we remain firmly in the midst of the Covid-19 pandemic. Data is at the close of business on the 28th of October 2020.
This article was originally written for and published by Citywire South Africa on Wednesday, 4 November 2020. You can access more newsworthy content on their website citywire.co.za


