Total Investment Cost: NFB Asset Management Funds vs Competitors – Q1 2021
How NFB AM’s Total investment Cost stacked up over the first quarter of 2021.


Total Investment Cost (TIC) is a very useful tool that enables investors to have as complete as possible an understanding of the actual costs incurred when investing in collective investment schemes (CIS’s, unit trusts). TIC is composed of the Total Expense Ratio (TER) and Transaction Costs (TC). TER indicates all fees and charges involved in managing a fund and is required to be displayed on minimum disclosure documents (MDD’s). NFB’s latest set of MDD’s can be found here. TC is made up of the costs incurred while paying for all the underlying assets in a CIS, as well as the taxes and levies involved. TIC’s, TER’s and TC’s are expressed as a percentage of the CIS’s assets under management.
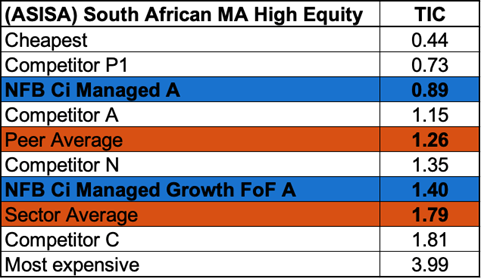
The average TIC within the ASISA: SA – MA - High Equity sector was 1.79%, 0.02% lower than the last quarter. Relative to this fee, the NFB Ci Managed Fund is cheaper by 0.90%, slightly less than half of the average, whilst the NFB Ci Managed Growth Fund of Funds’ is cheaper by 0.39%.
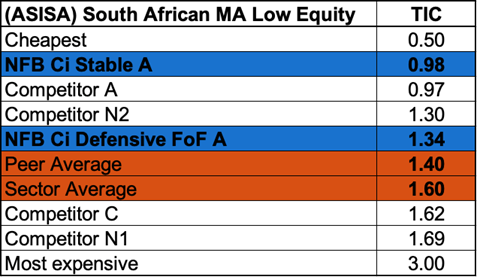
The average TIC within the ASISA: SA – MA - Low Equity sector was 1.60%, 0.01% higher than the last quarter. Relative to this fee, the NFB Ci Stable Fund is cheaper by 0.62% whilst the NFB Ci Defensive Fund of Funds is cheaper by 0.26%.
Peer averages in both sectors are the averages of the respective groups of CIS’s on the NFB Asset Management Onshore House View excluding the relevant NFB CIS’s.


